Do Merlin Populations Track Robin Populations in Winter?
by GEAS Guest Blogger Terry Rich
In a previous post, I talked about the huge number of American Robins we’ve had in the Boise area this winter (2022-2023) and possible reasons for that. It then dawned on me that I’ve also seen many more Merlins than usual. Merlins are bird eating specialists. They eat robins. Coincidence?
Rather than just depend on my feelings about Merlin numbers, I thought I’d dig into Merlin and robin data from the National Audubon Society Christmas Bird Count (CBC).
According to Birds of the World, Merlins prefer prey weighing less than 50 grams. So American Robins (77-85 g) are above the ideal range, but they sure do eat them. Some common feeder birds here in Idaho – House Sparrow (27 – 30 g), House Finch (16 – 27 g), and Dark-eyed Junco (18 – 30 g) are more in the ballpark. We also know that Merlins like to take prey out of the trees, coming in fast and surprising unsuspecting birds. All these species spend time in the branches.
Lag in Christmas Bird Count Data
One problem with CBC data is that you can’t get population trend data for a given species that includes the most recent years’ counts. Due to a glitch in the system, you can’t retrieve data more recent than 2014. I talked to the experts, and that’s a fact. Hopefully, National Audubon will fix it soon! Therefore, the 2022/2023 American Robin banner year data isn’t available yet.
But I always like to look at long-term, large-scale trends first anyway, so checking data from 1966 to 2014 would reveal a pattern, if it’s there. I chose 1966 as the starting point because the Breeding Bird Survey (BBS) started then, and we can compare CBC and BBS data thereby getting a picture from the wintering period as well as the breeding season. A topic for later.
Terry Dives Into the Data
So, what did I find?
CBC data for the entire U.S. show that Merlin numbers have increased more than 50 times during the period from 1966 to 2014! Counts went from 0.0031 birds per party-hour to 0.016. That increase is nearly linear (see Graph 1). American Robin numbers, on the other hand, have not changed over that same time period. Yes, there have been ups and downs (see Graph 1), but their long-term trend over that period is almost perfectly flat. Note that in the Graph 1 I had to multiply birds per party-hour for Merlins by 100 so I could put them on the same graph scale as robins. So, just look at the trends, not the numbers. Was I wrong?
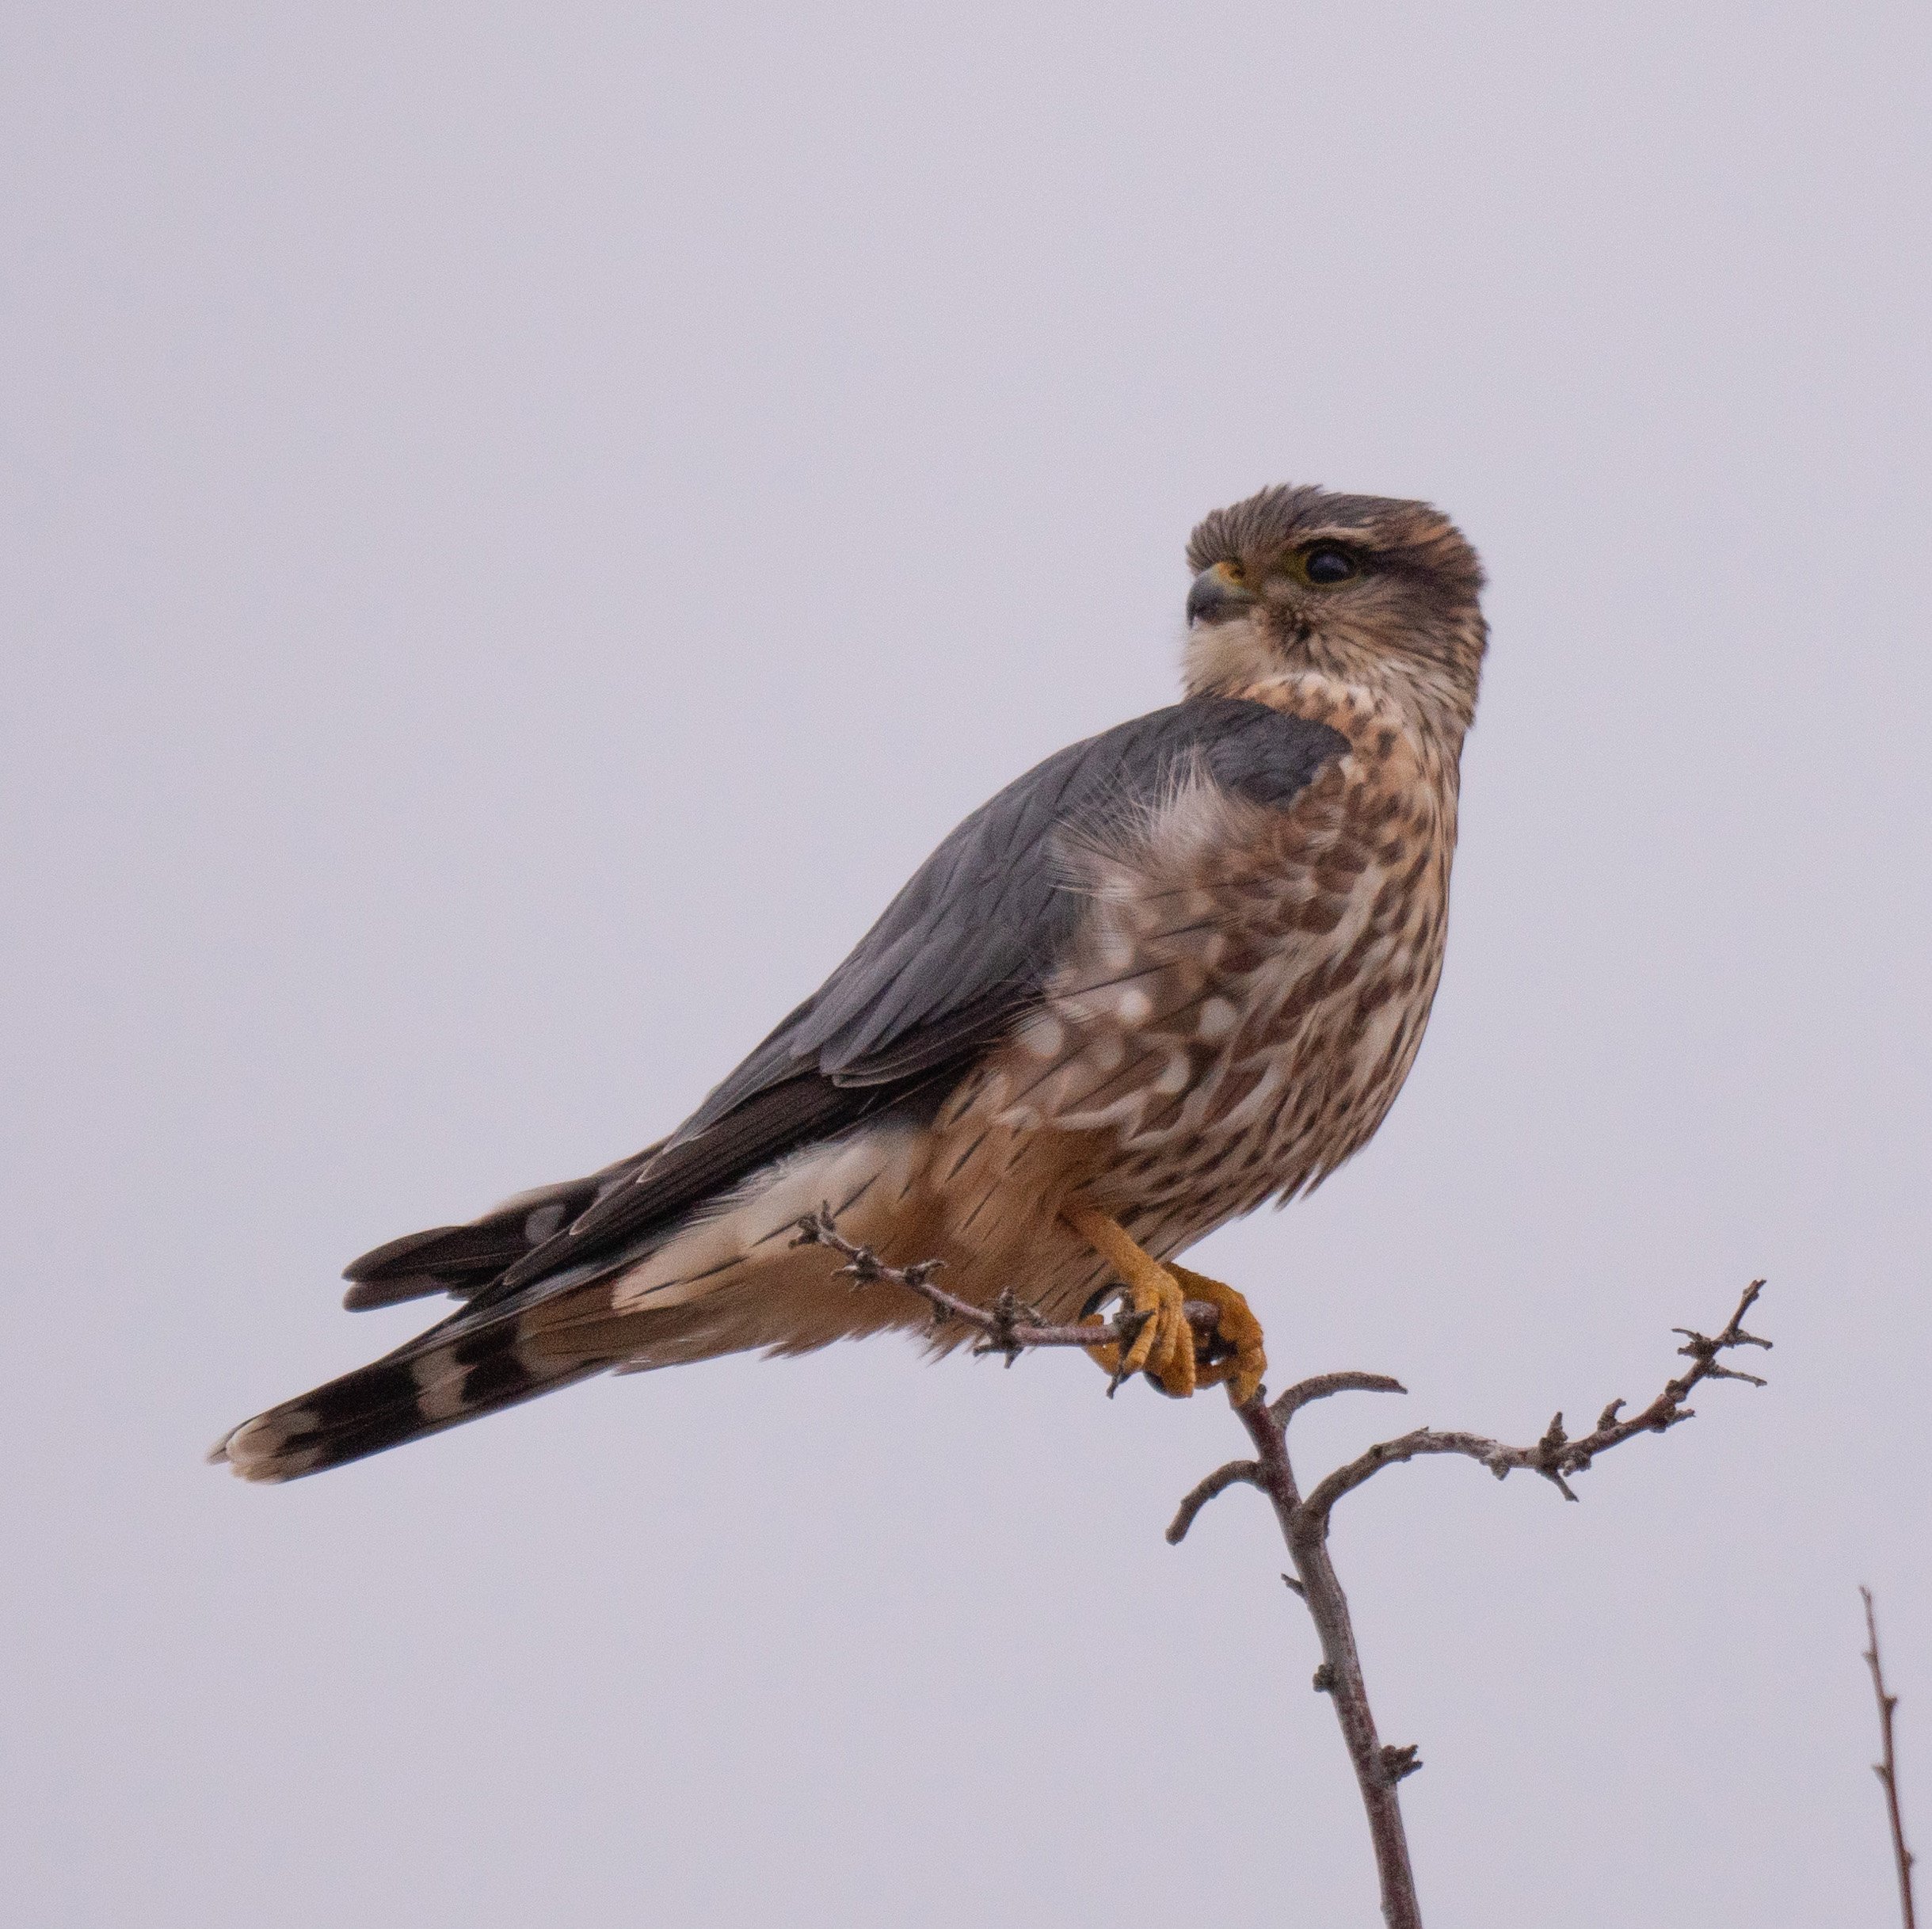
Merlin by Terry Rich

American Robin by Terry Rich

Graph 1
Looking Local
A thoughtful reader might say, hey, just because the long-term trends at the scale of the entire U.S. don’t align, it doesn’t mean that Merlins aren’t tracking American Robins at the local scale, which was my original question. That’s a valid point. So, let’s take a look at data from the Boise CBC.
Fortunately, when you retrieve data for a single CBC count circle like Boise, you get data for all species up to the most recent winter for which data has been uploaded. That’s the winter of 2021-2022.
The first cool thing about these trends (see Graph 2) is that both species have increased over the years in the Boise CBC. And despite all the variation from winter to winter, trends are correlated (r = 0.53). In a perfect synchronization, we would have r = 1.00. So, Merlin and American Robin long-term variations are significantly in synch.

Graph 2
Bottom line: Because these species do not have the same long-term trends at the scale of the U.S. but are significantly in synch from year to year in the Boise area, I think we can conclude that Merlins are tracking robins around here. There are many possible details to be resolved, but that’s my story and I’m sticking to it!
You can reach Terry at terryrichbrd@gmail.com